Introduction
TokenAnalytics is a free, local-first observability dashboard for AI coding agents — no signup, no cloud, no telemetry.
What is TokenAnalytics?
TokenAnalytics is a free, open-source, 100% local dashboard that reads the log files your AI coding agents already write and surfaces them in one unified place. It tracks token usage, LLM costs, tool calls, session traces, and reasoning steps across Claude Code, Codex, Gemini CLI, Cursor, Copilot, Qwen, OpenCode, Vibe, Antigravity, Grok Build, and Hermes Agent.
No signup. No cloud. No data leaves your machine. One command to start.
The local-first promise
All data stays in ~/.tokenanalytics/ on your machine. TokenAnalytics reads the log files agents already write — it never modifies them. The only outbound call is an optional hourly update-check to GitHub (no usage data, just a version request). You can disable that too.
Who it's for
| If you are… | TokenAnalytics helps you… |
|---|---|
| An individual developer | See exactly what your AI sessions cost and what the agent did |
| An engineering team | Compare Claude Code vs Gemini CLI vs Codex efficiency across projects |
| A Hermes Agent operator | Monitor a Telegram/Discord/cron bot across 38 source platforms |
| A prompt engineer | See token breakdowns to optimize prompts |
| A researcher | Study LLM agent behavior, tool call patterns, and reasoning chains |
How it's different
Unlike Langfuse, LangSmith, or Helicone, TokenAnalytics requires no SDK, no API key, and no code changes. It works by watching the log files your agents already write.
| TokenAnalytics | Langfuse | LangSmith | Helicone | |
|---|---|---|---|---|
| 100% local | ✓ | ✗ | ✗ | ✗ |
| Zero config | ✓ | ✗ | ✗ | ✗ |
| No signup | ✓ | ✗ | ✗ | ✗ |
| Free & open source | ✓ | Freemium | Freemium | Freemium |
What you'll see
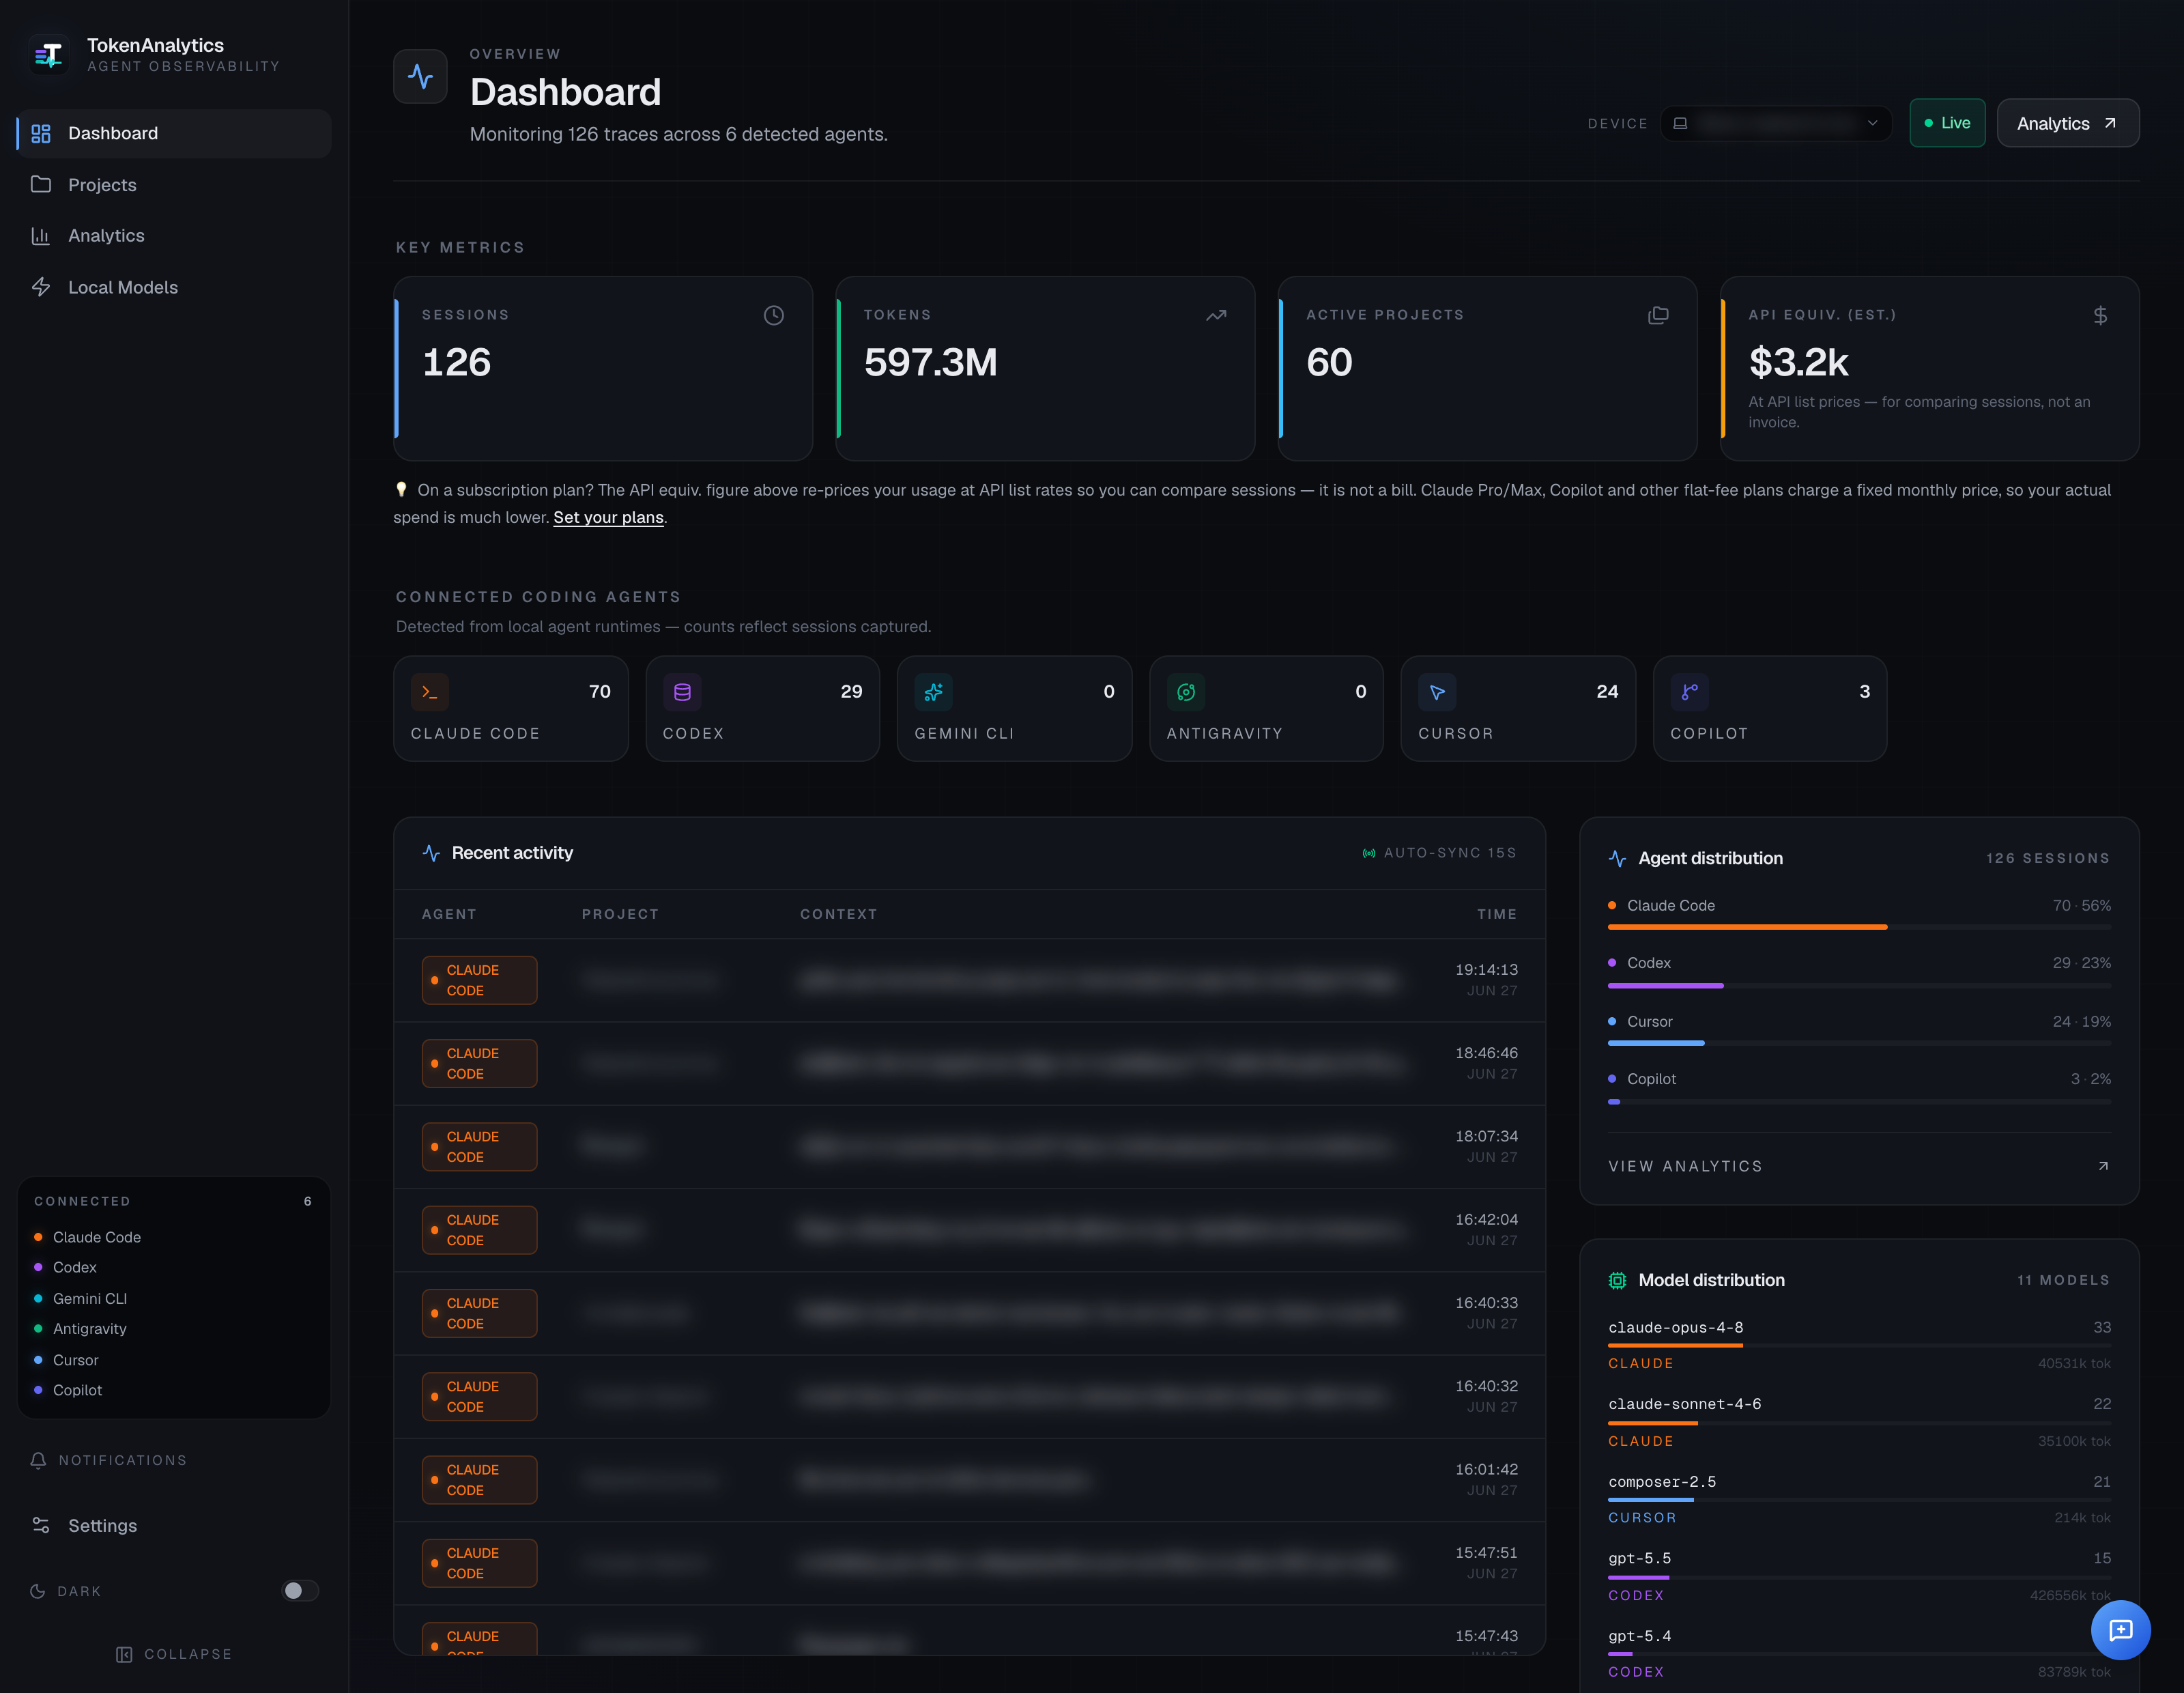
- Dashboard — live KPI strip (sessions, tokens, projects, cost) with 15-second auto-refresh, agent/model distribution charts, and a recent activity feed.
- Analytics — date-range filters, per-agent and per-model breakdowns, token area charts, cache-efficiency metrics, and a Delegation & Ecosystem section that shows subagent spend, skills used, and MCP servers.
- Traces — a replayable session trace: events, messages, tool calls, artifacts, and plan-mode output, with kind-aware highlighting and an honest label on encrypted reasoning.
- Summarization — one-click LLM narrative or structured brief (What / Tools / Why / Next) for any session, with caching by content hash and classified (never-raw) error cards.
- Projects — one card per working directory, with a 365-day heatmap, streaks, tool usage, configuration overlays, and a plans library.
- Hermes Agent — dedicated
/hermeshub with gateway health, 38 source platforms, scheduled jobs, per-API-call latency, skills, memory, and soul.
Quick links
- Installation — one-line installer or clone & run
- Quick Start — first launch and auto-detection
- Supported Agents — which agents are tracked and how